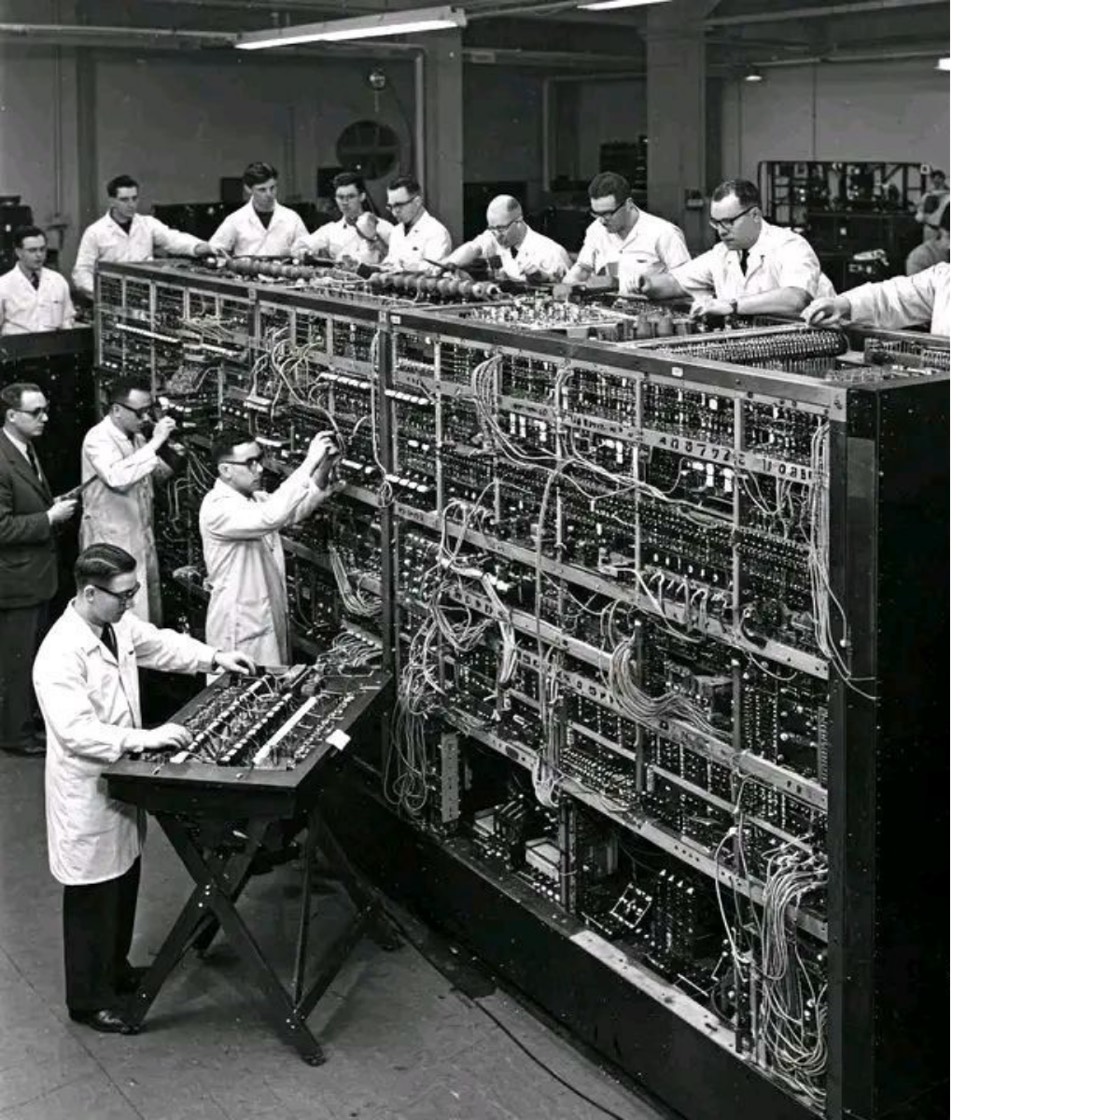
Engineers at work on an early mainframe computer

Performance-first architecture

Most graph databases bolt analytics onto an engine built for transactions. We took the opposite path, applying the columnar, vectorised architecture proven in analytical databases to graphs. Traversals return in milliseconds and stay there as the graph grows.

Get in touch

Architecture

Columnar storage

Every property lives in its own contiguous array, the layout proven in analytical engines like ClickHouse and DuckDB. A label scan touches one column instead of deserialising whole node records, and aggregations run straight over dense integer arrays.

Vectorised execution

Most engines use the Volcano model and walk one row at a time. Each TuringDB operator takes a whole column per call, so SIMD covers many values per instruction and branch prediction works on homogeneous data.

Reads that never wait

Immutable DataParts mean a query never contends with a write. There are no locks to acquire, so the engine skips lock management entirely and even an uncontended query pays none of that overhead.

No index to maintain

The column is the index. Property scans are fast enough that no separate structure is needed, so there is nothing to build, tune or keep in sync. In our benchmarks TuringDB still wins most property filters against engines that kept theirs.

Built to be fast at the depth where others cannot reach

Depth as a capability, not a setting. Most engines are built to answer what sits next door, so the question shrinks to fit the tool. We built for the opposite: let the question run as far as the problem actually reaches, and keep the answer in milliseconds the whole way out.

Details

Benchmark details

TuringDB is measured on variable-depth traversal, the operation that separates graph engines once a query leaves the neighbourhood it started in. The same query shape, the same machine, and nothing tuned for any engine.

Methodology and the full result set are linked below.

Dataset

Biomedical knowledge graph

Reactome
About

Reactome is an open, peer-reviewed pathway database. As a graph it is 2,978,202 nodes and 11,537,843 edges of reactions, proteins and pathways, connected densely enough that one question crosses many relationship types.

Evaluation

Variable-depth traversals from one to twenty hops, returning every distinct endpoint reached. Run cold on an Intel Core Ultra 7 265, 20 cores and 64G RAM, with no caching, no indexing and no tuning.

Result

TuringDB returns at every depth, from 4.73 ms at one hop to 5,876.51 ms at twenty. The others stop between eight and ten hops on out-of-memory or timeout. Across the 36 completed comparisons the geometric mean speedup is 38x.
Results
  • EngineLatency
  • TuringDB4.73 ms
  • Ladybug25.89 ms
  • FalkorDB304.95 ms
  • Neo4j393.79 ms
  • Memgraph456.59 ms
  • EngineLatency
  • TuringDB3.91 ms
  • Ladybug38.43 ms
  • Memgraph310.86 ms
  • FalkorDB322.82 ms
  • Neo4j394.34 ms
  • EngineLatency
  • TuringDB4.71 ms
  • Ladybug80.76 ms
  • Memgraph303.28 ms
  • FalkorDB304.96 ms
  • Neo4j384.44 ms
  • EngineLatency
  • TuringDB9.24 ms
  • Ladybug197.65 ms
  • Memgraph304.99 ms
  • FalkorDB342.96 ms
  • Neo4j378.00 ms
  • EngineLatency
  • TuringDB27.81 ms
  • Memgraph354.98 ms
  • Neo4j424.72 ms
  • Ladybug462.49 ms
  • FalkorDB894.38 ms
  • EngineLatency
  • TuringDB80.01 ms
  • Neo4j534.74 ms
  • Memgraph674.10 ms
  • Ladybug1,177.08 ms
  • FalkorDB4,278.74 ms
  • EngineLatency
  • TuringDB107.66 ms
  • Neo4j832.08 ms
  • Memgraph2,740.38 ms
  • Ladybug3,938.18 ms
  • FalkorDB26,807.87 ms
  • EngineLatency
  • TuringDB259.22 ms
  • Neo4j1,845.16 ms
  • Memgraph15,100.46 ms
  • Ladybug16,056.11 ms
  • FalkorDB171,046.18 ms
  • EngineLatency
  • TuringDB479.99 ms
  • Neo4j6,207.17 ms
  • Memgraph89,765.13 ms
  • Ladybugout of memory
  • FalkorDBtimed out
  • EngineLatency
  • TuringDB844.47 ms
  • Neo4j24,400.75 ms
  • Memgraph540,213.56 ms
  • Ladybug–
  • FalkorDB–
  • EngineLatency
  • TuringDB5,876.51 ms
  • Memgraphtimed out
  • Neo4jtimed out
  • Ladybug–
  • FalkorDB–
View full report

Full benchmark results

Read more
Query latency by traversal depth across five graph engines
Hops Distinct ends TuringDB Memgraph Ladybug Neo4j FalkorDB
1 55 4.73 ms 456.59 ms96.4x 25.89 ms5.5x 393.79 ms83.2x 304.95 ms64.4x
2 536 3.91 ms 310.86 ms79.5x 38.43 ms9.8x 394.34 ms100.8x 322.82 ms82.6x
3 2,958 4.71 ms 303.28 ms64.3x 80.76 ms17.1x 384.44 ms81.5x 304.96 ms64.7x
4 12,813 9.24 ms 304.99 ms33.0x 197.65 ms21.4x 378.00 ms40.9x 342.96 ms37.1x
5 42,205 27.81 ms 354.98 ms12.8x 462.49 ms16.6x 424.72 ms15.3x 894.38 ms32.2x
6 105,256 80.01 ms 674.10 ms8.4x 1,177.08 ms14.7x 534.74 ms6.7x 4,278.74 ms53.5x
7 222,615 107.66 ms 2,740.38 ms25.5x 3,938.18 ms36.6x 832.08 ms7.7x 26,807.87 ms249.0x
8 411,777 259.22 ms 15,100.46 ms58.3x 16,056.11 ms61.9x 1,845.16 ms7.1x 171,046.18 ms659.8x
9 643,077 479.99 ms 89,765.13 ms187.0x out of memory 6,207.17 ms12.9x timed out>1250x
10 876,262 844.47 ms 540,213.56 ms639.7x – 24,400.75 ms28.9x –
20 1,808,968 5,876.51 ms timed out>102x – timed out>102x –

Each cell shows the measured time and, beneath it, how many times longer that engine took than TuringDB. Pick a depth above to read the times for that row.

Newsletter

Updates, releases, and what we build next.